← Back
TH+ Cell Analysis
From a fluorescence z-stack to per-cell measurements, with the validation left in.
Tyrosine hydroxylase marks the neurons that make dopamine, so counting and measuring TH-positive cells is a standard way to study those populations. This is an automated pipeline that detects TH-stained cells in a microscopy stack and describes the population by staining intensity, morphology, and spatial organization, in physical units. Built with Yuki Ogawa, Serena Pen, and Simai Wang.
Pipeline
- Project. Maximum-intensity projection along z to bring out bright cell bodies.
- Denoise. Gaussian and median filtering compared; a light median filter kept cell-like structure best.
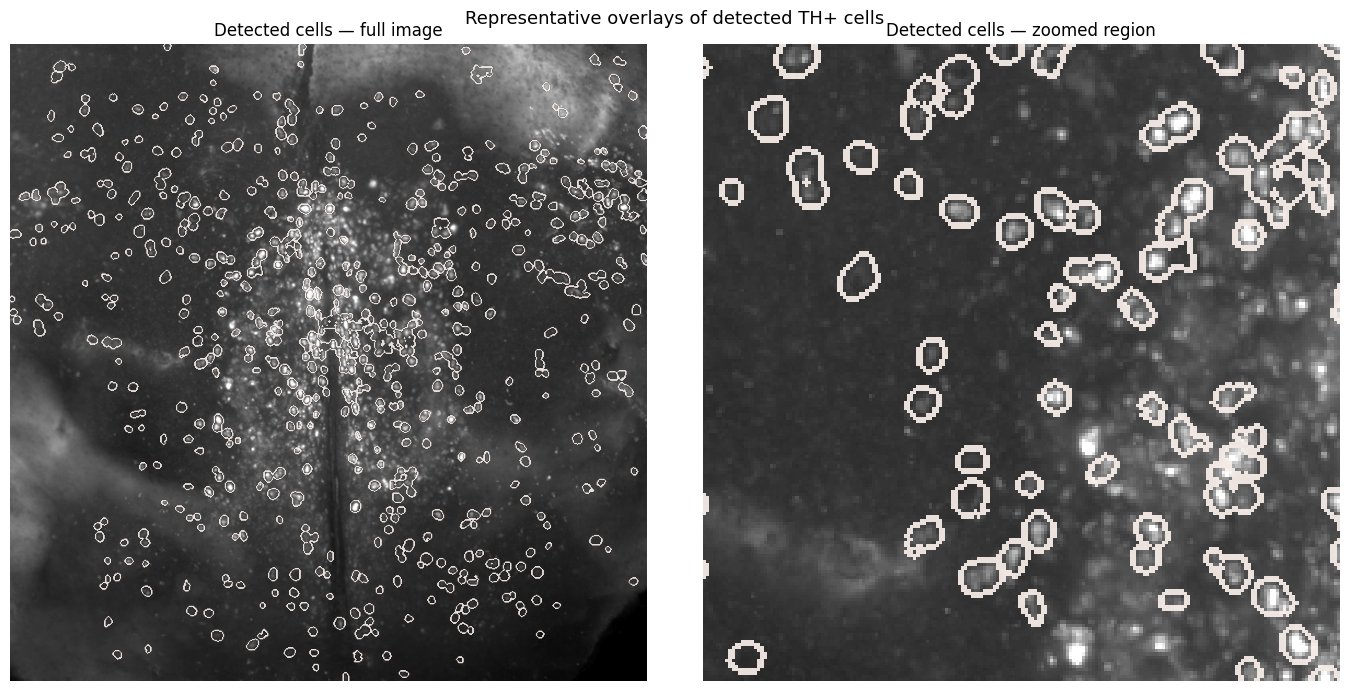
- Segment. Pretrained Cellpose on GPU, then a size filter to drop noise and merged blobs. 486 cells kept.
- Measure. scikit-image regionprops for mean intensity, area, axis lengths, eccentricity, and aspect ratio, converted to µm at 2.34 µm per pixel.
- Locate. KD-tree nearest-neighbor distances: mean 29.7 µm, median 24.9 µm. Most cells sit one or two cell diameters from a neighbor.
Validation, Honestly
We hand-annotated 616 cells in Fiji on the same projection and matched detections within 20 px using a greedy KD-tree assignment. The result: precision 0.40, recall 0.32, F1 0.35. That is a weak score, and the useful part of the project is knowing exactly why.
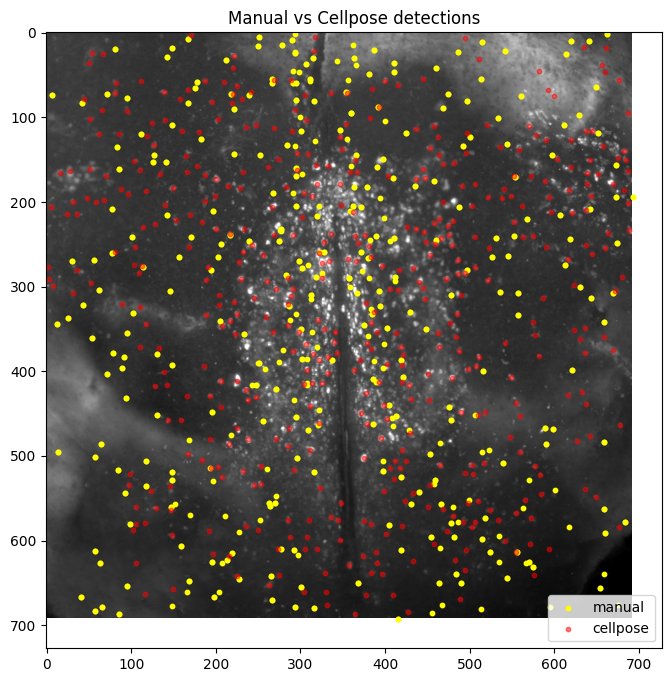
- Merged neighbors. Along the dense midline, touching cells get one contour where there should be two or three. Projecting 3D to 2D makes this worse, because cells at different depths overlap.
- Missed dim cells. Low-signal cells in peripheral regions fall under the detection threshold.
- Precision is a lower bound. Some "false positives" are probably real cells the manual pass missed.
- What would fix it. Segmenting the full z-stack in 3D, a parameter sweep scored against the annotations, and fine-tuning Cellpose on TH-stained images.
Read the Report
Stack
PythonCellposescikit-imageSciPyNumPyMatplotlibFijiColab GPU